Notes on Currents (starpath.com/currents)
...always a work in progress brought to you by Starpath School of Navigation.
Here is the main eye-opener to modern knowledge of currents. It is a fantastic video from NASA called Perpetual Ocean. We reference here the primary source link. It has been placed on YouTube by many folks, but the resolution is compromised in many and most omit the full credits. Click the picture below to go to the NASA source. You can also download a hi-res copy of the video from that link. Watch the dates change in the video to get a rough estimate of time scale. These are model output, but still a good look at what we must deal with in the ocean.


The key word here is mesoscale eddy. They are all over the ocean. They can pass by you in half a day, or they can last for a month. Peak currents in these eddies can reach 5 kts. Two to three knots is not uncommon. Read about mesoscale eddies at the excellent and extensive AVISO section on mesoscale eddies. (AVISO stands for Archiving, Validation and Interpretation of Satellite Oceanographic data. They have a *very* complicated website, so save this link!)
* * *
We have done a lot of current comparisons with ocean row boats. The results at that time were not very encouraging. This is described here: A comparison of ocean current models. RTOFS is based on GOFS and that was just updated (mid 2017) to v3.1, which shows notable improvements, so all of this early work is outdated. We did do a recent study comparing RTOFS and NCOM predictions with HF Radar measurements, which had mixed results. See notes on OSCAR below.
PS. We also routed this same rowboat across the North Atlantic in 2006 from NYC to Falmouth, England. For that work we used the Navy maps (below) augmented by SST data from Johns Hopkins. The models were not much use in those days, and we had no grib versions to work with. This venture deserves a special write up as we were successful in keeping the boat in favorable water and learned a couple tricks. They won the first (and last) Great North Atlantic Rowing Race, setting a new record in the Guinness Book for the first row across the Atlantic that actually arrived at the intended destination. Earlier records just claimed victory crossing a specific longitude, even if they were in the wrong country.
We also have discussion of current measurements in the work we did with Jacob Adoram row from Seattle to Australia.
VARIOUS OCEAN AND COASTAL CURRENT REFERENCES,
IN NO PARTICULAR ORDER
Keeping Current with Ocean Currents (an overview and update, which ends up coming back to this page!)
For discussion of global currents see Chapter 36 of the latest (2017) Bowditch... or maybe better still find an older version to supplement this one. The coverage seems to be going down. It has an excellent chart of major current flow patterns and short discussions of each system. PS, as of some point in 2018, NGA discontinued chapter downloads so you need to get the full 109 MB book.
Row Boats in Ocean Currents
NCEI Resources on Ocean Currents
HF Radar currents
HF-Radar Coastal Current Measurements
NDBC Presentation of HF radar currents
Global Hf Radar Stations
Limited HF-Radar data for HI
See also this SUPER NEAT PRESENTATION of Global Hycom Current forecasts from SOEST HI. Scroll the left panel to see all the many options there. You can compare their ROMS model predictions with HF-Radar measurements. See this video on how to get to the HYCOM current forecasts.
• RTOFS currents in GRIB format are available from Saildocs and from within most nav apps. Get RTOFS in GRIB format direct from NOMADS. Get RTOFS in netcdf (.nc) format to open in Panoply and make exports to Google Earth. The data are issued daily starting with h12 and then every 24h to h108. That is 5 forecasts, 24h apart starting on 12z.
• Mercator, also called MyOcean, is a strong competitor for best global current model from CMEMS in France. It is available in most of the leading commercial nav apps. qtVlm has the option to link from within the app. See notes on primary source below.
Article and Video on the Use of Panoply to View NetCDF Currents
• NCOM is a regional Navy model and considered superior to RTOFS where it is available. NCOM is offered by Expedition, LuckGrib, and qtVlm. You can also get NCOM data by full region direct from NOMADS. These grb2 files can be viewed in OpenCPN. They are about 29 MB.
OSCAR
• OSCAR currents in GRIB format are available within qtVlm using the Meltemus Gribs options.
• ( Historic sources from LuckGrib, Expedition, SV Sarana, and Saildocs are no longer active. )
OSCAR are not model forecasts, they are one day averages of reanalyzed satellite-based measurements of current flow. The data are updated daily with 0.25º resolution, but there is a 2-day latency for the version they call Near Real Time (NRT)—on Jan 8 we get the daily average from Jan 6. Samples are in our comparison link above.
We have found that these OSCAR averages are the best way to plan a route across the Equatorial currents and countercurrents. It is also likely that the OSCAR data might be the best to use for optimum sailboat routing in some cases, but with the speed increased by about x(1.2 to 1.5). A video example from Sydney Hobart.
Because of the value of this data, we have set up a custom eway to get historic data (back to 2021) grib format, starting with netcdf format from the NASA Earth Data Library. See:
starpath.com/OSCAR.
Note there is a set of OSCAR data called INTERIM that has a 5-day latency, which is in principle a bit more accurate than the NRT.
Our text Modern Marine Weather has an extended section on how to obtain various ocean weather related products from saildocs as well as from FTPmail, and other sources, along with detailed discussion of ocean and tidal currents.
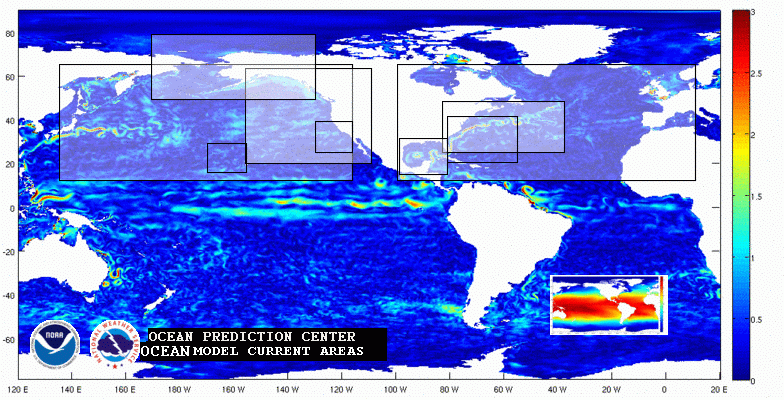
Ocean Model Current Areas
https://ocean.weather.gov/Current_fcasts.php
The NCEP Global Real-Time Ocean Forecast System (RTOFS-Global) data is based on the U.S. Navy implementation of Global HYCOM. Regional NCOM data is provided by the Naval Oceanographic Office (NAVO). This link has many data sources plus a way to get a crude graphic view. The inactive pic below shows the regions you can access online.
RTOFS GLOBAL MODEL INFORMATION
The Global Real-Time Ocean Forecast System is based on NAVO's configuration of the 1/12 deg. eddy resolving global HYCOM model and is initialized daily with NAVO generated initial conditions using the NCODA system. RTOFS Global is forced with NCEP's operational GFS winds. For more details see:NOAA/NCEP/MMAB RTOFS Global Web Page
Copernicus model from Mercator (MyOcean) in France
Very good global data in this online viewer. Data can be exported to Google Earth.
GLOBAL_ANALYSIS_FORECAST_PHY_001_024 Then click the download button to access the filter controls, Lat-Lon and time frame.
The settings controls the opacity of each parameter shown, the downloads arrow lets you set the area to be downloaded. The currents are geostrophic values based on the altimetry. The data are in NetCDF.
You can get these MyOcean (Mercator) currents in GRIB format from LuckGrib

REGIONAL NCOM MODEL INFORMATION
The Regional NCOM models produce 4-day forecasts at 3-hour time steps, updated at 00Z daily. FNMOC interpolates the output onto a regular grid with 1/30 degree (~3km) resolution in the horizontal and 40 levels in the vertical; prior to April 5, 2013, the resolution was roughly 1/36 degree. The NetCDF files contain ocean temperature, salinity, eastward and northward currents, and elevation, along with the atmospheric forcing fields provided over the model domain by a 15 km application of the Navy's COAMPS model. The regional NCOM ocean prediction systems assimilate all quality-controlled observations in the region including satellite sea surface temperature and altimetry, as well as surface and profile temperature and salinity data using the Navy Coupled Ocean Data Assimilation (NCODA) system. Boundary conditions are applied from the FNMOC operational 1/12 degree Global HYCOM. Prior to April 2013, boundary conditions were applied from the Navy operational Global NCOM.
Present regional data (grib 2)
New Section on Gulf Stream, in progress...
See super nice presentation by Frank Bohlen at the bermudarace.com site. Includes actual analysis of past races across the current.
Excellent overview of the Gulf Stream by retired Prof. Craig Gilman, who gave us permission to archive his presentation after it was taken down at Carolina University. See: starpath.com/Gulf_Stream .
We leave these notes on US Navy GS data, keeping in mind that they sometimes go offline for a while.
NAVO color images. (Historically) THE STARTING POINT (in our approach) FOR GULF STREAM ANALYSIS: North part color graphic (BW digital) and the South part and GOM color graphic (BW digital )
Here is the location of the main index now being used. Here is the new home at NCEI, which is hopeful. Compare these with the OPC data: Inshore limit of the southern Gulf Stream
If the Navy maps go missing, we can get good satellite temp images from the NOAA Office of Satellite and Product Operations. Look at the North Atlantic image with contours. This is a file that can be coded into qtVlm for auto updates, as can the others there. Also available for other parts of the world. See starpath.com/overlays.
Also at the bottom of the NCEI page above are shapefiles of the boundaries that can be loaded into qtVlm.
Our note on Gulf Stream Sources off the Coast of Florida
Video on importing the Navy Gulf Stream boundaries into echart program as a gpx file.
Sites on the Web for Sea Surface Temperature (SST) and Gulf Stream information.
NOAA SOURCES
http://polar.ncep.noaa.gov/ofs/
http://polar.ncep.noaa.gov/sst/
http://www.ospo.noaa.gov/Products/ocean/index.html
http://polar.ncep.noaa.gov/
http://www.cdc.noaa.gov/
http://www.nhc.noaa.gov/aboutsst.shtml
http://www.goes.noaa.gov
http://www.aoml.noaa.gov/phod/data.php
http://www.elnino.noaa.gov/
NAVY SOURCES (these often do not work!.... or you may have to tell your browser to accept pages without valid security certificates.)
http://www.usno.navy.mil/
https://www.fnoc.navy.mil
http://www7300.nrlssc.navy.mil/?P=Division%20Research
https://oceanography.navy.mil/legacy/web/cgi-bin/graphic.pl/metoc/223/19/0-0-5/1
UNIVERSITY SOURCES
http://secoora.org/data/marineweatherportal
https://marine.rutgers.edu/cool/sat_data (our favoriate)
http://fermi.jhuapl.edu/index.html
http://rads.tudelft.nl/gulfstream/
Tidal currents
Background: Tidal Analysis and Predictions, technical paper with much data including on rotary currents.
Does not address the new models covered beow.
Operational Forecast System (OFS) — The Ongoing Revolution in Navigation
The future of tides and currents is already here. Read about the model here, showing where there are data: https://tidesandcurrents.noaa.gov/models.html
Our videos on OFS are at starpath.com/videos
For the time being, the only GRIB format of the data are available from Expedition, LuckGrib, and qtVlm who each converts the published data in netCDF to GRIB and then lets us export it to other programs if needed. qtVlm output also includes the digital soundings and water depth, as extracted from the OFS output.
Video showing how to compare OFS to harmonic predictions. The main NOAA viewer for the OFS data is called OceansMap, which is still in Beta. Choose a region from the bottom panels, then wait a bit to see the colors then vectors load.
A very nice presentation of the Salish Sea Model data can be seen in a NANOOS viewer

Australian currents are covered well at the AU IMOS site, usually with an overview of conditions just before the Sydney-Hobart Race on Boxing Day. Below is the 2025 example.
