Tropical Atlantic OCEAN CURRENTS —Dakar to Miami see Ocean Rowing Navigation Blog for notes on the trip |
UTC =
GMT CLOCK
|
• See notes on Row Boats in Ocean Currents
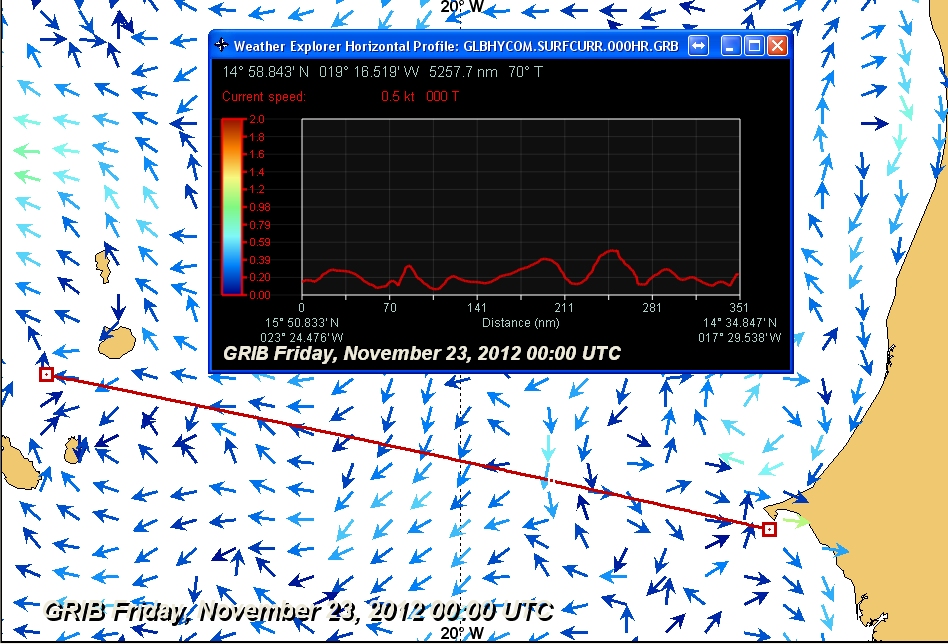
• Hycom 1/12 Africa side Florida side. This navy data has very poor resolution in this display, but we are looking for other sources.
• Hycom available from Miami via Ocens Weather Net (we must update this one manually)
• Geostrophic currents from altimetry. Click the image to get to the index
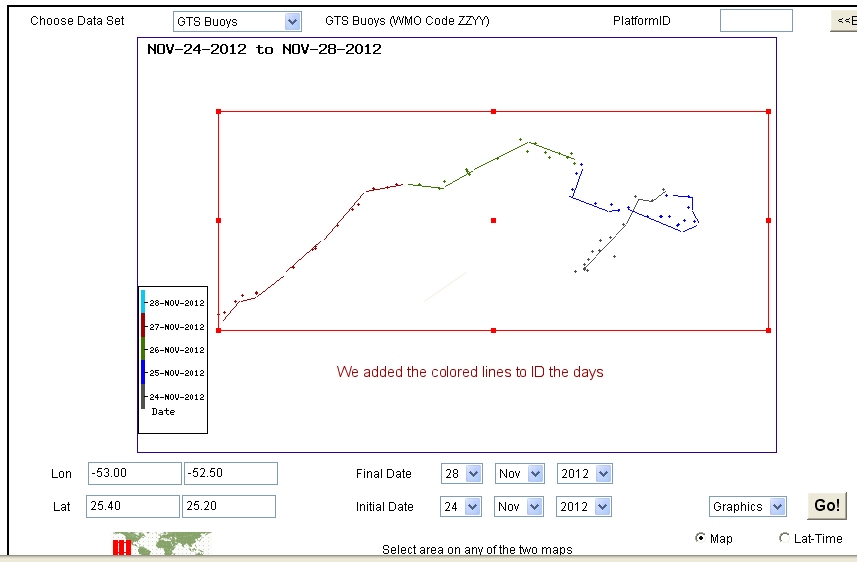
• You can track Drifter Buoys at this site, have to zoom in then id the colors with dates. Then when you find the region you care about it will not show lat-lon, so you need to make a new box, then use judicious choice of limits so you can interpolate the locations. In this example it is 0.2° lat from top to bottom, which is 12 nmi. Then figure distances and times (each color is 24h) and you can compute the drift and see what the average currents are looking like. The green on Nov 26 was roughtly 12 nmi/day (0.5 kt), but it was faster in the dark red on the 27th. We see typical results here. Net drift is to the west, but there was a definite eddy on Nov 24-25, 2012.
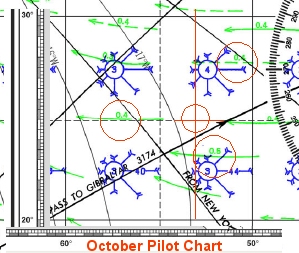
Below is the Pilot Chart which shows for this location (circled cross) that the expected currents are about 0.4 to 0.5 kts, which is what we observe for today from these drift data. The green arrows are the currents, labels in kts; sold green means more persistent than dashed green. Nice to see things actually checking out, but the Pilot Chart climatic monthly averages do not know about daily variations nor eddies. We know the eddies can be very strong on the scale of row boat speeds. See the blog post on current eddies.
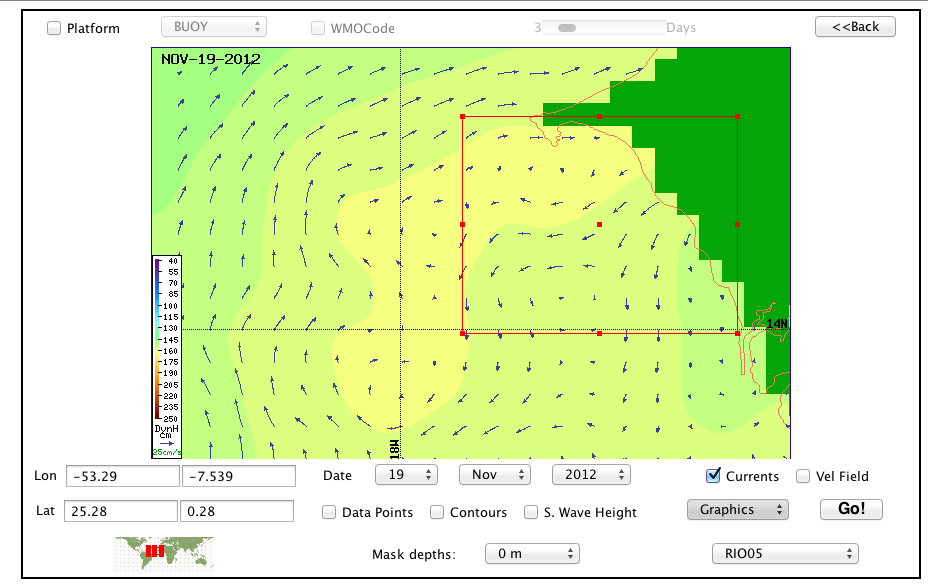
• Model data from Mercator.fr (hard to read, but we can at least see limits or rivers as they might develop. Note 1 m/s = ~2 kts (1.94)
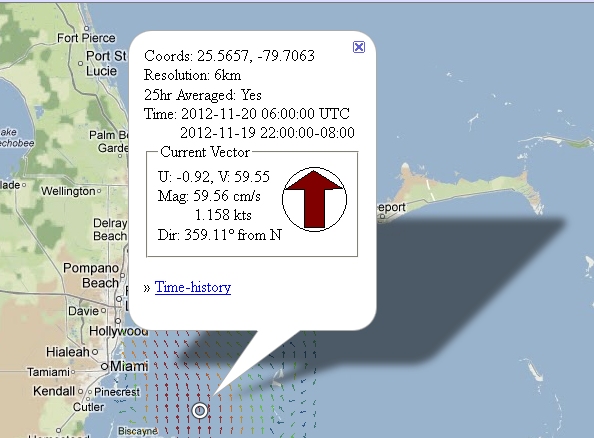
• Florida currents covered nicely by CORDC. These are the best coastal current data we have, but only a dozen or so locations have the measurements. We will use this once we get within current field shown. The link above shows where these are around the country. About everywhere except Washington State! You can also load them into Google Earth, but the original site has better data presentation, as shown below.
see Ocean Rowing Navigation Blog for notes on the trip