BACKGROUND
Even in the age of satellite communications and remarkable marine weather resources, our knowledge of the correct atmospheric pressure, and how it changes, at our location remains the key to safe, efficient routing decisions at sea. Pressure data are also the most direct means of evaluating official weather analyses and forecasts. Although the pressure data provided has applications in other areas, features of this app have been specifically designed for convenient, effective use in marine navigation, which is why we include GPS position, COG, SOG, and UTC with each pressure display. Your GPS track can also be exported to Google Earth or a navigation program.
CAUTION
Barometers in mobile devices (cellphones and tablets) are a tremendous convenience; they are usually accurate over a broad pressure range once set to a known correct pressure. Without calibration, they are typically right to within ±2 mb, often notably better, and indeed the relative accuracies are better still, but like all barometers they should be compared periodically to a known standard, as outlined below.
DEFINITIONS
Atmospheric pressure at a given place is the weight of the air above that place per unit area. A typical value would be 14.7 lbs per square inch (1 kg per square centimeter). Therefore, at any location, the pressure goes down as you go up in the atmosphere, because then there is less air above you.
Standard units of pressure for maritime use are millibars (mb) or the equivalent hectoPascals (hPa). All marine weather forecasts and weather maps used by the US National Weather Service (NWS) and internationally use these units, which are the World Meteorological Organization (WMO) standards. Aviation and U.S. "TV weather" use inches of mercury (inHg), and science labs and European barometers generally use millimeters of mercury (mmHg), which are also called Torr.
Q-codes are 3-letter abbreviations originally developed for telegraph messages, i.e., QSL means "message received." Many of these have lingered into modern times as they can serve to clarify communications. Barometer usage employs three of these: QFE, QNH, and QFF, as described below.
Sensor pressure is the raw output from your device's pressure sensor. This app allows you to apply a sensor offset to that value as needed.
Station pressure (QFE) is the sensor pressure corrected for sensor offset, if any has been entered in the Settings. Station pressure is the atmospheric pressure at the location (position and elevation) of the device at the time it is read. This pressure will always be lower than sea level pressure, unless your phone is floating on the sea surface. How much lower, depends primarily on how high you are above sea level (station elevation.)
Sea level pressure (QNH) is the atmospheric pressure at your location that would be measured at sea level at that moment and place. (If you were on land on a hill 100 ft high, it would be the pressure your barometer would read at the bottom of a 100-ft deep hole.) It is the station pressure increased to account for your elevation above sea level (station elevation), assuming the atmosphere is adequately described by the International Standard Atmosphere. This is a good approximation, and this pressure (QNH) is the working value of sea level pressure used in marine navigation. Strictly speaking, there are other small corrections besides the elevation that contribute to the true sea level pressure shown on weather maps (QFF), but outside of extreme temperatures and high elevations, we can use QNH as our value for sea level pressure. Aviation weather forecasts call QNH the "altimeter setting."
Sea Level Pressure (QFF) is the sea level pressure shown on weather maps and given in forecasts. For essentially all practical applications at sea we can approximate this adequately with QNH by correcting station pressure for elevation alone. In extreme temperature conditions from a high deck of a ship, there could be additional corrections approaching ±0.5 mb.
At high elevations on land, however, this can be a notable correction (up to 10 mb or more), in which case it must be accounted for as explained in the books listed in the References below. On high land where this correction is needed, you would have to know the average outdoor air temperature over the past 12 hours.
Sea Level Pressure (SLP) is the generic name and abbreviation of sea level pressure used when the above distinctions are not being made, which is indeed most of the time in marine applications. The abbreviation MSLP shown on some weather maps refers to the pressure at the mean sea level, because the sea level is always rising and falling to some extent. In essentially all contexts, SLP is the same as MSLP.
USES OF THE APP
The app reads the atmospheric pressure sensor built into your phone or tablet, and then stores that pressure
in several files that we can view as a graph of pressure versus time. Such a plot is what distinguishes a barograph from a barometer.
This app can be used several ways. As part of your active phone, it offers a way to measure and record the pressure (and other navigational data) viewed only periodically. In this application, the graphs and data logs will have gaps of missing data. Alternatively, you can dedicate an otherwise unused phone to become a state of the art electronic barograph, equivalent to those costing many hundreds of dollars or more. This must be iPhone 6 or newer; for Android there are more options to be checked to see which includes a barometer. One easy check is load the free Marine Barometer app to see if it reads a pressure. For this application you would want to keep the phone powered on to maintain a continuous record of the pressure. The app is designed to have a large digital pressure display that can be read across the room, nav station, or pilothouse.
Below are the several screens available, with functions highlighted. The SETTNGS section below explains the set-up options.
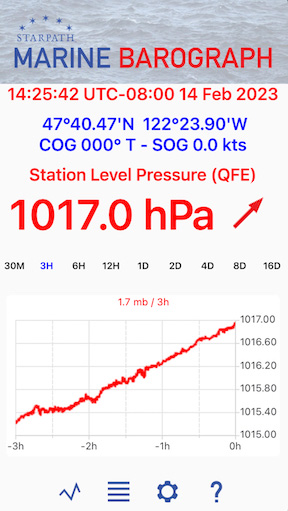
This is the main screen of the app. Get here with the graph button, bottom left. The top shows the present time and location of the device, along with the course over ground (COG) and speed over ground (SOG) when moving. We determine these values from the GPS data (location services); COG and SOG are discussed further below.
The present pressure is showing in large numbers, followed by a trend indicator. The diagonal up arrow means the pressure is rising. To see a trend icon, there must be pressure data stored for a time that is one hour earlier than the present time. This could be a continuous record, or just an interval of data at that time. Else only a dashed line will show. PRESSURE TREND ARROWS are discussed further below.
The initial screen always shows the 30-minute graph (30m), but in this image the 3-hour (3h) graph has been selected. On the 3h graph we also see the pressure tendency, which is how much the pressure has changed over the past three hours. To see this value, the device must have a full three hours of data stored, else it will show as dashes. See PRESSURE TENDENCY below for more information.
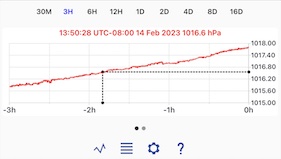
To read specific values from the graph, slide your finger along the graph to engage the indicator lines. The precision and pressure intervals on the graph are determined by your choice of display precision in the Settings. These can be 0, 1, or 2 decimal places. The pressure and time will appear above as shown and remain until the next update. The graphs can be pinch zoomed and dragged to see more detail. Double tap the graph to reset the view. The two dots above the bottom line of buttons are a reminder that you can swipe the top line of display tabs to see digital display below.
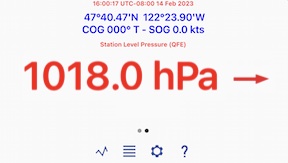
Swipe again to return to the graph. This display is made purposefully large so it can be read from a distance when using the app in a dedicated phone as a precision barograph.
The swipe and arrow functions are not used in the tablet version, which has larger displays. In the tablet version, the landscape and portrait views are similar.
VIEW / EXPORT DATA LOGS
The view data button (four lines, second from left) takes you to an index of the files storing the data, shown below.
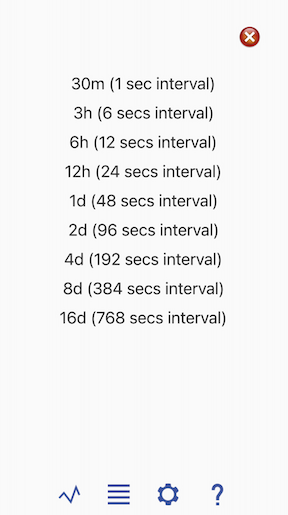
The pressure is read once per second and stored in the 30m file; then every 6s (6 sec) the value is stored in the 3h file; every 12s in the 6h file; and so on. The data in these files are what is shown in the graphs. The Delete button (top right) offers the opportunity to delete ALL data in ALL files. A confirmation is required to proceed.
Clicking any one of these files shows part of the contents of the file, adhering to time and unit choices made in the settings.
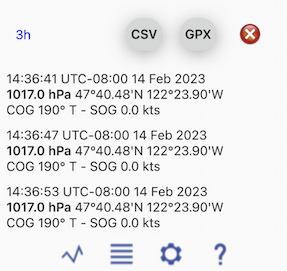
The time format is hhmmss. The pressure and position displayed here is from the Settings. COG is always degrees true and SOG is always knots = 1 nautical mile per hour.
Note this is just a numerical display of selected terms that match the Settings choices. When you export the CSV file you will get all parameters for every data point stored.
The Delete button here is the option to delete just this one data file, without disturbing the others.
The CSV button shares all data in this file as a CSV file to other devices or store it in a mobile device folder. This data can then be archived or imported into a spreadsheet program for further analysis of the pressure or navigation data.
The GPX button lets you share a track file of all positions and the associated times stored in this file. The GPX file can be imported to a navigation or weather program for analysis and route planning. This file can also be displayed on Google Earth.
BACKGROUND OPERATION
For those who would like a continuous barograph trace, you can leave the app running as you switch to other apps or screens or set the device aside over night. As long as the app is running it will accumulate data in the graphs and data files even when not showing on the screen. In the iPhone version, an indication the app is running is a small blue icon in the top corner of the screen. You can click that blue icon for a direct return to the Marine Barograph app. In the Android version there is a small Marine Barograph icon at the top of the screen indicating that the app is running in the background. Note that continual use of the location services needed to access your position and barometer reading, is a continual load on the battery that should be monitored and likely call for more frequent charging. Any running navigation program would cause this same concern.
SETTINGS
Language: English or French.
Theme: Light, Dark, Device. Dark is for night use. Device means it follows your main device choice.
Time Zone: Device time zone is the one set in your device, this will change with location and time of year. For marine work we need to know the pressure at universal times UTC (once called GMT), and in particular at the synoptic times of 00, 06, 12, and 18 UTC. For global coverage, device times are specified relative to UTC. A device time of 12:05:32 (UTC-8:00) means 8h behind UTC, which would be same as 20:05:32 UTC.
Date format: month day or day month.
Time format: Marine weather and navigation uses a 24 hour clock, i.e., 1330 rather than 12-hr time, 1:30 PM. You can choose between 12h and 24h time clock frame.
Pressure units: Millibars (mb) and hectoPascals (hPa) are two equivalent units used in marine weather, universally. KiloPascals (kPa) are used in Canada. Millimeters are used in Europe and globally in science labs.
Speed units: Choose from knots (kts), miles per hour (mph), or kilometers per hour (km/h).
Precision display: In this app, normal precision refers to one decimal place, corresponding to the marine weather standard, i.e., 1013.3 mb. High precision is two decimal places; low precision is no decimals. Weather maps typically show isobar spacings of 4 mb. This setting affects the digital display of the pressure as well as the stored data in the View Data files. The precision of the vertical scales in the barographs and in the exported data are always in high-precision regardless of this setting.
Position format: Choose between degrees and decimal minutes (ddd mm.mm) or in decimal degrees (ddd.dddd). In decimal format, N Lat and E Lon are positive; S Lat and W Lon are negative. There is an option for dd mm ss, but this is not used much in marine navigation.
Pressure display level: Choose between sea level pressure (QNH) or station pressure (QFE).
Line style: Options are Spline, for a smoothed curve, or Straight, for a point to point straight line plot.
UDP NMEA Output: Select a port number for a live WI-FI broadcast of the pressure via user datagram protocol (UDP). Values such as 10110 are common port numbers for transmitting NMEA data. NMEA is a data format used in navigation programs, so broadcasting your pressure this way allows navigation and weather programs near you to receive the input.
There is an option to include position information as well in the broadcast, thus making your Marine Barograph app effectively a backup GPS for your electronic charting system (ECS). See your ECS manual on how to configure it to receive NMEA data via UDP. Note that not all mobile devices with a barometer also include a GPS.
Station elevation: This is the height of the barometer above mean sea level (MSL). In the ocean, this can be considered height above the waterline (H). In tidal waters, we have to account for the tide height (T). So station elevation = H + T - MSL, where MSL = (MHW + MLW)/2. For examples and illustrations see books listed in the References below. The input is meters, with a feet to meters converter for convenience.
On land, you can get the elevation of the ground at your location from Google Earth based on your Lat-Lon. Then we need the height of the barometer above the ground (called the removal), or station elevation = ground elevation + removal. For examples and illustrations see books listed in the References below.
Sensor offset: This is a correction to apply when you believe that the device sensor itself is not precisely correct. It should only be applied when you have good reason to question the sensor reading, which (considering the typical accuracy of the sensors) is not easy to determine unless your device is sitting next to another barometer that is certified correct. When you compare pressures with a friend's device, side by side, and they do not agree, then at least one of them needs a sensor offset. This offset would typically be less than a few millibars. There are two ways to set the offset.
(1) You have a certified accurate barometer in view physically next to your phone.
In Settings, set the Precision Display to High, and set the Pressure Display Level to Station Level, and scroll down to the Sensor Offset (mb). You will see the present reading of the station pressure below the ± control buttons. Recall that hPa and mb are the same units.
Press the plus or minus buttons until the displayed pressure next to them matches the value of the certified accurate barometer. Then press the graph button to check that your station pressure now matches the calibrated value. Note using station pressure this way, the value set in station Elevation does not matter.
(2) You have knowledge of the correct sea level pressure at your location at this moment and you know the elevation of your device above sea level at this moment... i.e., ground elevation plus elevation above the ground.
In Settings, set the Precision display to High, and set the Pressure Display Level to Sea Level, set the Station Elevation to the height of the phone above sea level, and scroll down to the Sensor Offset (mb). You will see the present reading of the sea level pressure below the ± control buttons.
Press the plus or minus buttons until the displayed pressure below them matches the known value you have of the correct sea level pressure. Again then press the graph button to check that your sea level pressure now matches the known value.
Determination of an accurate offset is typically an iterative process of making your best estimate once, and then checking it periodically at various pressures. See notes and videos on the setting process in the Resources listed below.
COG and SOG
Course over ground (COG) and speed over ground (SOG) are fundamental navigation parameters we obtain from the GPS (global positioning system) satellite navigation system. The GPS records your position and the time of that position and then a few seconds later it records that data again, and then it computes the direction from previous position to the present one, which tells us the true direction we are moving. The distance between these two points divided by the time between them is the SOG.
This crucial navigation information is stored in the several data logs we use, which lets the app serve as an automated logbook for your navigation, as well as a backup to your console navigation system on the vessel.
Knowing your course and speed also helps interpret pressure changes that you detect in the barograph trace. If you are sailing into a stationary Low, you will detect the pressure drop at the same rate that you are crossing the isobars of the Low, and so on.
PRESSURE TENDENCY
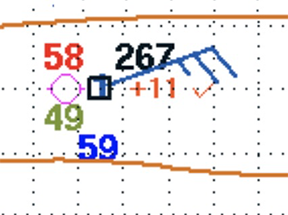
The rate that the pressure changes in the units of mb (or hPa) over the past three hours is an official NWS and WMO parameter called the pressure tendency (PTDY). It is recorded on all weather maps that show ship reports. In the report below, PTDY is +1.1 mb/3 hr, shown in orange letters. In this report, the SLP is 1026.7. PTDY are plotted at 10 times the value. Thus +0.6 would show up as +06, -2.3 would show up as -23.
We show the value of PTDY on the 3h graph, at the top of the graph. This will only show when there is stored data available from 3 hours ago, else it shows - - - -. This is a dynamic value that can change on each pressure update. Pressure tendency is always displayed in mb (same as hPa), regardless of other display choices in Settings, to match its official definition.
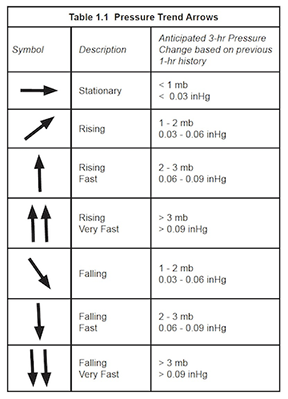
PRESSURE TREND ARROWS
The pressure trend arrows are shown next to the digital value of the pressure. These arrows indicate the trend in the pressure based on the change over the past 1 hour. There must be pressure stored for one hour ago, or the display will show just - - -.
SIGNIFICANCE OF PRESSURE CHANGES
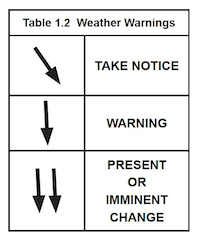
Broadly speaking, Falling (diagonal arrow) is a Take Notice signal; Falling Fast (one vertical arrow) is the important Alert or Early Warning signal; and Falling Very Fast (two vertical arrows) could well be already accompanied by bad weather, or if not, it should be considered an Imminent Warning of potentially severe weather.
Keep in mind as well that strong winds can also come with fast rises in the pressure; it is the gradient that causes the wind, not the value of the pressure itself.
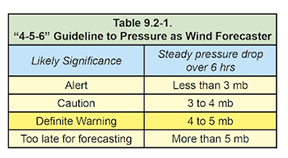
In our textbook, Modern Marine Weather, we propose the mnemonic "4-5-6" to remind us that any pressure drop of 4 or 5 mb over a 6 hr period is reason to pay attention to the pressure and weather. Changes less than that do not often mean much.
RESOURCES
Sources of accurate pressure: We offer a free service at starpath.com/barometers for obtaining accurate pressure from the nearest ten stations to your Lat-Lon, along with a way to accurately average them for time and place. You can also interpolate the local SLP worldwide from the surface analysis maps at the Ocean Prediction Center (ocean.weather.gov). These maps are updated at the synoptic times.
References: Our related textbooks include: Modern Marine Weather, The Barometer Handbook, and Mariner's Pressure Atlas. Each book has its own online support page with more practical resources. Good barometer work is the key to good weather work, and these books tell you how to do both.
These books along with video illustrations of the use of this app are at starpath.com/marinebarograph, which also includes an index to articles on various aspects of barometer use.
The captain who watches his barometer,
watches his ship.
Copyright © 2026, Starpath Corporation