BACKGROUND
Even in the age of satellite communications and remarkable marine weather resources, our knowledge of the correct atmospheric pressure, and how it changes, at our location remains the key to weather analysis everywhere and to safe, efficient routing decisions at sea. Pressure data are also the most direct means of evaluating official weather analyses and forecasts.
This app was originally developed for marine applications using phones and tablets that had both a pressure sensor and a GPS sensor providing the user with the latitude and longitude position of the device, as well as how fast they are moving (speed over ground (SOG) and which direction they are moving, course over ground (COG). This computer (Mac or PC) based version of the app designed to read the Starpath USB barometer does not expect or require position information, but if this information is available on your computer, the app can read it and store it in a log along with the pressure data.
DEFINITIONS
Atmospheric pressure at a given place is the weight of the air above that place per unit area. A typical value would be 14.7 lbs per square inch (1 kg per square centimeter). Therefore, at any location, the pressure goes down as you go up in the atmosphere, because then there is less air above you.
Standard units of pressure for maritime use are millibars (mb) or the equivalent hectoPascals (hPa). All marine weather forecasts and weather maps used by the US National Weather Service (NWS) and internationally use these units, which are the World Meteorological Organization (WMO) standards. Aviation and U.S. "TV weather" use inches of mercury (inHg), and science labs and European barometers generally use millimeters of mercury (mmHg), which are also called Torr.
Q-codes are 3-letter abbreviations originally developed for telegraph messages, i.e., QSL means "message received." Many of these have lingered into modern times as they can serve to clarify communications. Barometer usage employs three of these: QFE, QNH, and QFF, as described below.
Sensor pressure is the raw output from your device's pressure sensor. This app allows you to apply a displayed pressure offset to that value as desired, and as a way to fine tune the calibration of the sensor itself—providing you are 100% confident you have a reference pressure that is more accurate. Discussed below.
Station pressure (QFE) is the sensor pressure corrected for sensor offset, if any has been entered in the Settings. Station pressure is the atmospheric pressure at the location (position and elevation) of the device at the time it is read. This pressure will always be lower than sea level pressure, unless your phone is floating on the sea surface. How much lower, depends primarily on how high you are above sea level (station elevation.)
Sea level pressure (QNH) is the atmospheric pressure at your location that would be measured at sea level at that moment and place. (If you were on land on a hill 100 ft high, it would be the pressure your barometer would read at the bottom of a 100-ft deep hole.) It is the station pressure increased to account for your elevation above sea level (station elevation), assuming the atmosphere is adequately described by the International Standard Atmosphere. This is a good approximation, and this pressure (QNH) is the working value of sea level pressure used in marine navigation. Strictly speaking, there are other small corrections besides the elevation that contribute to the true sea level pressure shown on weather maps (QFF), but outside of extreme temperatures and high elevations, we can use QNH as our value for sea level pressure. Aviation weather forecasts call QNH the "altimeter setting."
Sea Level Pressure (QFF) is the sea level pressure shown on weather maps and given in forecasts. For essentially all practical applications at sea we can approximate this adequately with QNH by correcting station pressure for elevation alone. In extreme temperature conditions from a high deck of a ship, there could be additional corrections approaching ±0.5 mb.
At high elevations on land, however, this can be a notable correction (up to 10 mb or more), in which case it must be accounted for as explained in the books listed in the References below. On high land where this correction is needed, you would have to know the average outdoor air temperature over the past 12 hours.
Sea Level Pressure (SLP) is the generic name and abbreviation of sea level pressure used when the above distinctions are not being made, which is indeed most of the time in marine and other applications. The abbreviation MSLP shown on some weather maps refers to the pressure at the mean sea level, because the sea level is always rising and falling to some extent. In essentially all contexts, SLP is the same as MSLP.
USES OF THE APP
The Starpath USB Baro reads the pressure and exports it in the form of two NMEA sentences (XDR and MDF). The app reads these sentences and stores the pressure
and time in several files that we can view as a graph of pressure versus time. Such a plot is what distinguishes a barograph from a barometer.
As long as the app is running in your computer and the barometer is connected, it should collect data and store it. In other words, it should run in the background even when not in view on the screen. But there are various settings in Mac and PC computers that could interrupt this functionality. These need to be checked for your computer and operating system.
Below are the several screens available, with the buttons marked in magenta that open the screen. In the banner, the top left is a link to starpath.com; the top right is a link to the USB Baro page.
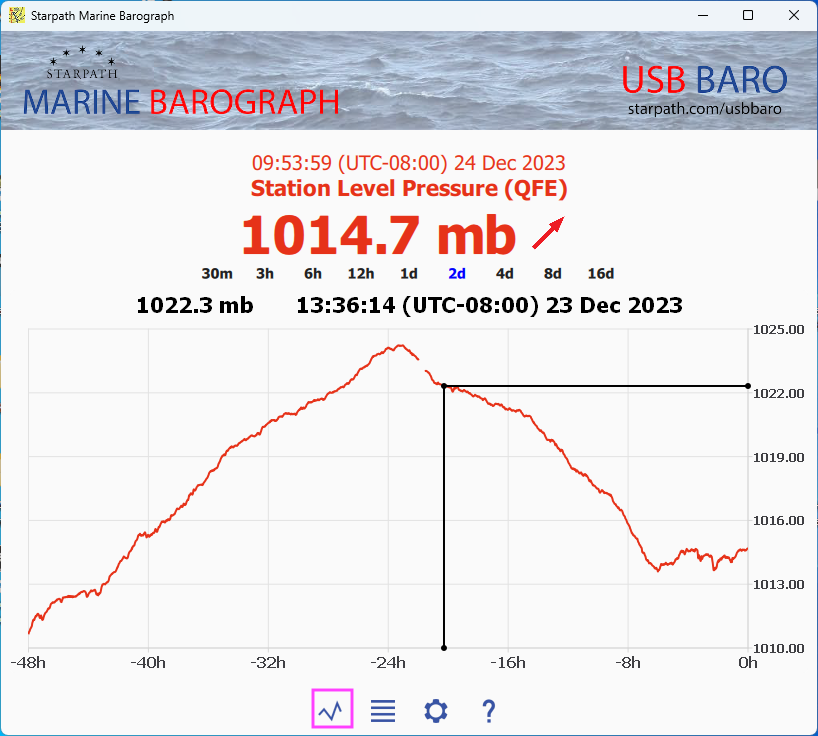
This is the main screen of the app. Get here with the graph button, bottom left. The top shows the present time, pressure mode, and present pressure, followed by the pressure trend indicator, discussed below.
A cursor on the graph reads out the time and pressure at that point. This display is for the pressures stored over the past two days (2d). You have the option to show the display over the past 30 minutes up to past 16 days, after which the data over write. As noted below it can be exported as needed.
You can pinch zoom or pan the screen to see details. Double click the screen to return to the base display.
The diagonal up trend arrow means the pressure is rising. To see a trend icon, there must be pressure data stored for a time that is one hour earlier than the present time. This could be a continuous record, or just an interval of data at that time. Else only a dashed line will show. More details on this important feature given below.
VIEW / EXPORT DATA LOGS
The view data button (four lines icon) takes you to an index of the files storing the data, shown below. Select here the one you want to view or export.
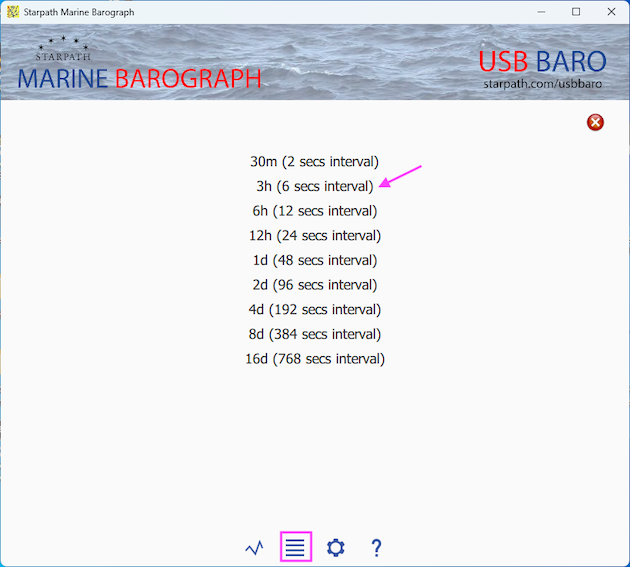
The pressure is read once per second and stored in the 30m file; then every 6s (6 sec) the value is stored in the 3h file; every 12s in the 6h file; and so on. The data in these files are what is shown in the graphs. The Delete button (top right) offers the opportunity to delete ALL data in ALL files. A confirmation is required to proceed.
Clicking any one of these files (such as 3h sample marked) shows part of the contents of the file, adhering to time and unit choices made in the settings.
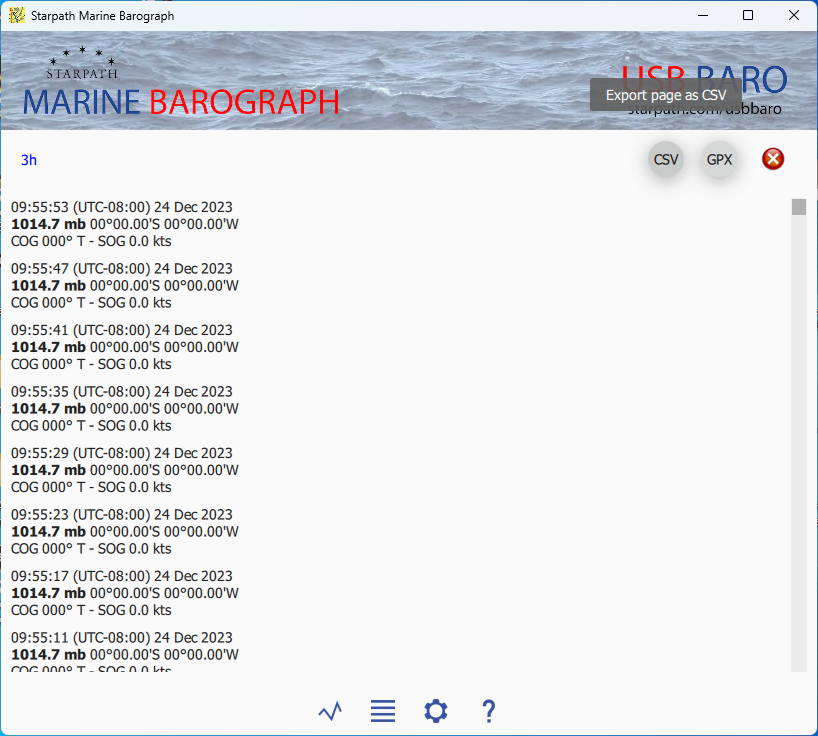
The time format is hhmmss. The pressure and position format displayed here is from the Settings. If your computer has location service providing Lat and Lon, this will be recorded, along with the motion of the device. Course over ground (COG) is always degrees true and speed over ground (SOG) is always knots = 1 nautical mile per hour. Many computers will not have this functionality unless you have a portable GPS attached, or you are sending the app this data via WI-FI (see Connections in Settings).
On the top right you export this data file as either a CSV file or a GPX file. The latter can be imported to Google Earth or any navigation app to show the locations of the pressure measurements.
BACKGROUND OPERATION
For those who would like a continuous barograph trace, you can leave the app running as you switch to other apps or screens or set the device aside overnight. As long as the app is running it will accumulate data in the graphs and data files even when not showing on the screen. Some computers or operating systems require special permissions to run in the background.
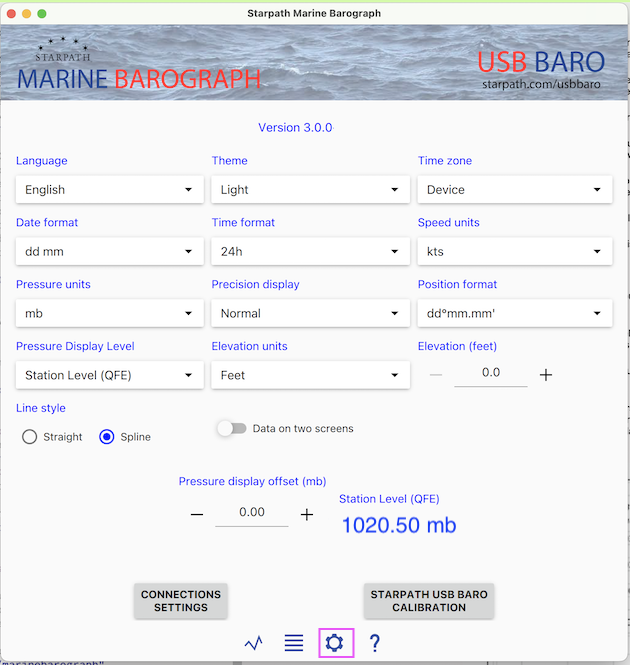
SETTINGS
Language: English or French.
Theme: Light, Dark, Device. Device means it follows your main device choice.
Time Zone: Device time zone is the one set in your device, this will change with location and time of year. For marine work we need to know the pressure at universal times UTC (once called GMT), and in particular at the synoptic times of 00, 06, 12, and 18 UTC. For global coverage, device times are specified relative to UTC. A device time of 12:05:32 (UTC-8:00) means 8h behind UTC, which would be same as 20:05:32 UTC.
Date format: month day or day month.
Time format: Marine weather and navigation use a 24-hr clock, i.e., 13:30 rather than 12-hr time, 1:30 PM. You can choose between 12-hr and 24-hr time clock frame.
Pressure units: Millibars (mb) and hectoPascals (hPa) are two equivalent units used in marine weather, universally. KiloPascals (kPa) are used in Canada. Millimeters are used in Europe and globally in science labs.
Speed units: Choose from knots (kts), miles per hour (mph), or kilometers per hour (km/h).
Precision display: In this app, normal precision refers to one decimal place, corresponding to the marine weather standard, i.e., 1013.3 mb. High precision is two decimal places; low precision is no decimals. Weather maps typically show isobar spacings of 4 mb. This setting affects the digital display of the pressure as well as the stored data in the View Data files. The precision of the vertical scales in the barographs and in the exported data are always in high-precision regardless of this setting.
Position format: Choose between degrees and decimal minutes (ddd mm.mm) or in decimal degrees (ddd.dddd). In decimal format, N Lat and E Lon are positive; S Lat and W Lon are negative. There is an option for dd mm ss, but this is not used much in marine navigation.
Pressure display level: Choose between sea level pressure (QNH) or station pressure (QFE).
UDP NMEA Output: Select a port number for a live WI-FI broadcast of the pressure via user datagram protocol (UDP). Values such as 10110 are common port numbers for transmitting NMEA data. NMEA is a data format used in navigation programs, so broadcasting your pressure this way allows navigation and weather programs near you to receive the input.
There is an option to include position information as well in the broadcast, thus making your Marine Barograph app effectively a backup GPS for your electronic charting system (ECS). See your ECS manual on how to configure it to receive NMEA data via UDP. Note that not all computers will include a GPS or location service function.
Station elevation: This is the height of the barometer above mean sea level (MSL). In the ocean, this can be considered height above the waterline (H). In tidal waters, we have to account for the tide height (T). So station elevation = H + T - MSL, where MSL = (MHW + MLW)/2. For examples and illustrations see books listed in the References below.
On land, you can get an accurate elevation of the ground at your location from Google Earth, worldwide. Then we need the height of the barometer above the ground (called the removal), or station elevation = ground elevation + removal. For examples and illustrations see books listed in the References below.
Line style: Straight draws a line directly from point to point; Spline is a mathematical interpolation process that averages out sequential data points for a smoother curve. The distinction is not notable until you zoom in on the graph.
CONNECTING THE USB BARO TO THE APP
(1) Plug USB Baro into a USB port.
(2) On the Settings page (gear icon) choose CONNECTION SETTINGS at the bottom of the window, scroll down if needed.
(3) Turn on Serial NMEA input.
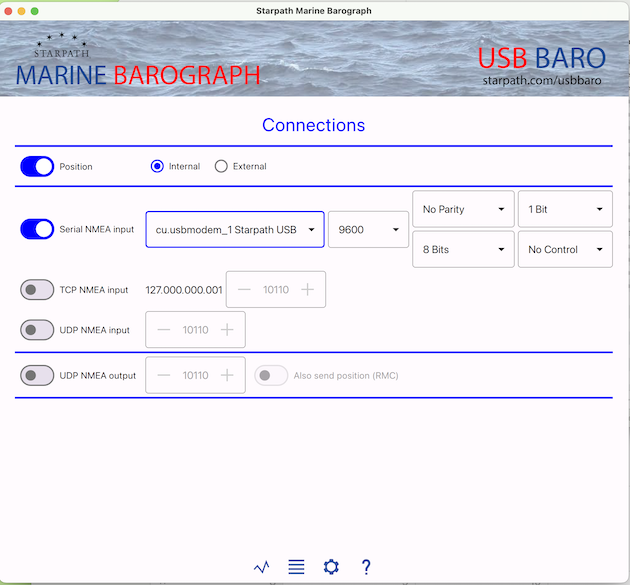
(4) For Mac computers: In the dropdown choose tty.usbmodem_1 Starpath USB. (Other settings can be left as default values: 9600 / no parity, 8 bits / 1 bit, No Control. )
(4) For PC computers: In the dropdown choose the com port associated with the USB port you used. Each USB port on the computer has a different com port number. If there are more than one com ports showing in the dropdown, note which ones are there, then remove the USB Baro, restart the app, and look again. The missing com number is the one you want. Plug the USB Baro back into the same port, and the right one will appear again, and choose that one. (Other settings can be left as default values: 9600 / no parity, 8 bits / 1 bit, No Control.)
(5) Then click the graph icon bottom of the page, and wait a few seconds for the data to appear.
(6) The trend arrows on the right will not show until you have collected an hour of data, or you have readings from an hour ago.
Display and record position data. Turn Position on and choose Internal or External source. Internal will use the Location Services of your computer (which must be turned on in computer settings). The position is determined by several means from your network environment. The External source will be looking for a UDP or TCP input connection of your choice, which you configure with the options shown.
USB BARO SENSOR CALIBRATION
USB Sensor offset: This is a correction to apply when you believe that the device sensor itself is not precisely correct. It should only be applied when you have good reason to question the sensor reading, which (considering the typical accuracy of the sensors) is not easy to determine unless your device is sitting next to another barometer that is certified correct. When you compare pressures with a friend's device, side by side, and they do not agree, then at least one of them needs a sensor offset. This offset would typically be less than a few millibars. There are two ways to set the offset.
(1) You have a certified accurate barometer in view physically next to your phone.
In Settings, set the Precision Display to High, and set the Pressure Display Level to Station Level, and scroll down to the Sensor Offset (mb). You will see the present reading of the station pressure below the ± control buttons. Recall that hPa and mb are the same units.
Press the plus or minus buttons until the displayed pressure next to them matches the value of the certified accurate barometer. Then press the graph button to check that your station pressure now matches the calibrated value. Note using station pressure this way, the value set in station Elevation does not matter.
(2) You have knowledge of the correct sea level pressure at your location at this moment and you know the elevation of your device above sea level at this moment... i.e., ground elevation plus elevation above the ground.
In Settings, set the Precision display to High, and set the Pressure Display Level to Sea Level, set the Station Elevation to the height of the phone above sea level, and scroll down to the Sensor Offset (mb). You will see the present reading of the sea level pressure below the ± control buttons.
Press the plus or minus buttons until the displayed pressure below them matches the known value you have of the correct sea level pressure. Again then press the graph button to check that your sea level pressure now matches the known value.
Determination of an accurate offset is typically an iterative process of making your best estimate once, and then checking it periodically at various pressures. See notes and videos on the setting process in the Resources listed below.
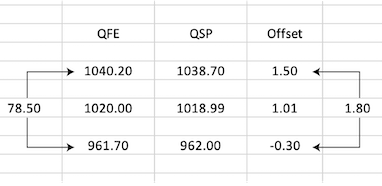
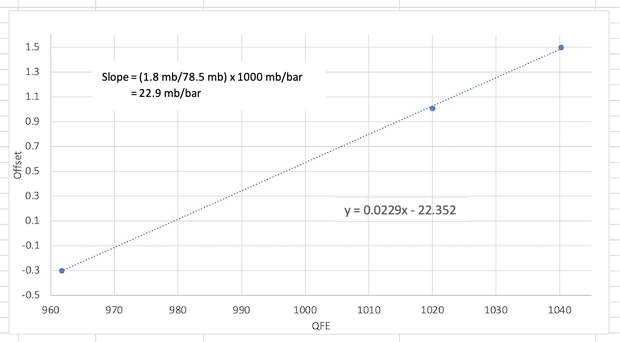
USB Baro sensor calibration slope: The Starpath USB Baro is unique in that it offers the opportunity to not just calibrate the sensor reading at one specific pressure as outlined above, but you can effectively apply a two-point calibration by entering a slope to the calibration corrections. It is unlikely this would be called for or justified, but if you use your device at both low and high elevations (see elevation table below) and have at hand a calibrated barometer to compare to or you have experienced large range pressure changes over time with a log of pressure differences, then you can figure a calibration slope as follows, using this sample record of pressure readings. The correction is always what you apply to the USB Baro reading to get the calibrated reading. The difference between the two reference pressures should be at least 50 mb.
This can then be entered into the USB Baro calibration page as shown here.
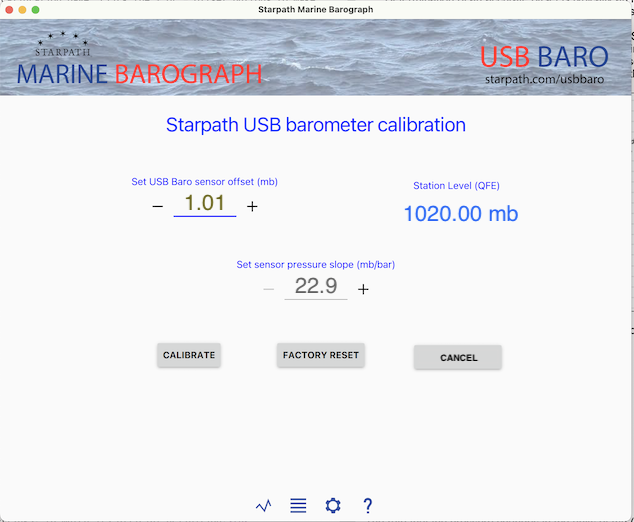
Again, when you enter this page, any previous values of the offset and slope will show, along with the existing station level pressure (disregarding any pressure display offset that might be in place). You can then override those values with your new calibration data. The ± keys by the offset will adjust the station pressure to the desired value. Then press CALIBRATE to register them in the device itself.
The FACTORY RESET button will zero out any user values of the offset or slope that may have been entered. The CANCEL button returns to the main display page without making any changes (assuming you have not pressed Calibrate or Factory reset). This is the same as selecting the graph icon on the left at the bottom.
The free online service at starpath.com/barometers is one way to find accurate sea level pressures. If you have a calibrated barometer in a mobile device you can use it to calibrate the Starpath USB Baro. Our mobile apps at starpath.com/marinebarometer are one convenient way to make these comparisons.
To estimate pressure changes with elevation, we can use these standard atmosphere values (see references cited below for more details).
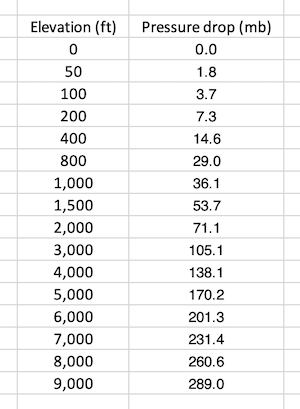
Aircraft maintain cabin pressures of typically 850 to 750 mb.
PRESSURE TENDENCY
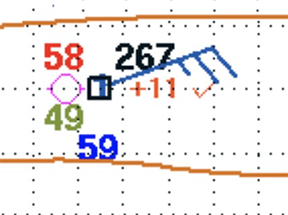
The rate that the pressure changes in the units of mb (or hPa) over the past three hours is an official NWS and WMO parameter called the pressure tendency (PTDY). It is recorded on all weather maps that show ship reports. In the report below, PTDY is +1.1 mb/3 hr, shown in orange letters. In this report, the SLP is 1026.7. PTDY are plotted at 10 times the value. Thus +0.6 would show up as +06, -2.3 would show up as -23. The orange symbol to the right tells us that during the past 3 hr the pressure was dropping then rising. This is the pressure tendency characteristic code 3 of nine possibilities.
We show the value of PTDY on the 3h graph, at the top of the graph. This will only show when there is stored data available from 3 hours ago, else it shows - - - -. This is a dynamic value that can change on each pressure update. Pressure tendency is always displayed in mb (same as hPa), regardless of other display choices in Settings, to match its official definition.
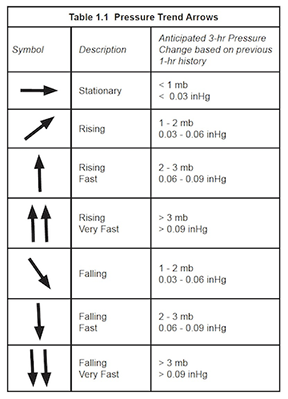
PRESSURE TREND ARROWS
The pressure trend arrows are shown next to the digital value of the pressure. These arrows indicate the trend in the pressure based on the change over the past 1 hour. There must be pressure stored for one hour ago, or the display will show just - - -.
SIGNIFICANCE OF PRESSURE CHANGES
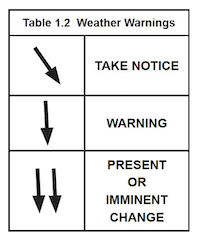
Broadly speaking, Falling (diagonal arrow) is a Take Notice signal; Falling Fast (one vertical arrow) is the important Alert or Early Warning signal; and Falling Very Fast (two vertical arrows) could well be already accompanied by bad weather, or if not, it should be considered an Imminent Warning of potentially severe weather.
Keep in mind as well that strong winds can also come with fast rises in the pressure; it is the gradient that causes the wind, not the value of the pressure itself.
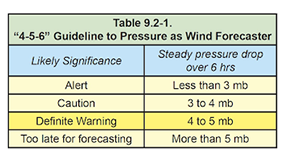
In our textbook, Modern Marine Weather, we propose the mnemonic "4-5-6" to remind us that any pressure drop of 4 or 5 mb over a 6 hr period is reason to pay attention to the pressure and weather. Changes less than that do not often mean much.
RESOURCES
Sources of accurate pressure: We offer a free service at starpath.com/barometers for obtaining accurate pressure from the nearest ten stations to your Lat-Lon, along with a way to accurately average them for time and place. You can also interpolate the local SLP worldwide from the unified analysis maps at the Ocean Prediction Center (ocean.weather.gov). These maps are updated at the synoptic times.
References: Our related textbooks include: Modern Marine Weather, 3rd edition, The Barometer Handbook, and Mariner's Pressure Atlas. Each book has its own online support page with more practical resources. Good barometer work is the key to good weather work, and these books tell you how to do both.
These books along with video illustrations of the use of this app are at starpath.com/marinebarograph, which also includes an index to articles on various aspects of barometer use.
The captain who watches his barometer,
watches his ship.
Copyright © 2024, Starpath Corporation