Use of Current Charts Underway
Current charts are graphical displays of the tidal current flow in a particular region. Generally they are perennial publications, linked to annual data on the current strength, or sometimes on the tide height, at a specific reference point in the region. They give nominal speed and direction of the current hourly, but then the exact speeds must be scaled by the actual current speed at the reference point whenever it is much different than the average value.
Each picture or page of the tables is then given a time dependent on the present time of slack water or peak flow at the reference point. Their big advantage is they give you an overall picture of the flow pattern, which is always better than a few specific values and a few specific points. That is the general usage, often done hour at a time, or just when called for underway. But when the current really matters, we can do better with some extra preparation.
We sell two types of current charts, and there are also others available for other parts of the world. The example below is using the Canadian Current Atlas for the eastern end of the Strait of Juan de Fuca, down into Admiralty Inlet, the north part of Puget Sound. You could do the same for the region south of this using the Puget Sound Current Tables.
Here is an example of this preparation (for a yacht race) that we just ran across when cleaning up our chart locker. It is a good example of this process, but you can obviously improvise to meet your needs. Instead of just throwing this outdated sheet into the trash—as we have done many times before—we stop a moment to share this example of one way to prepare.
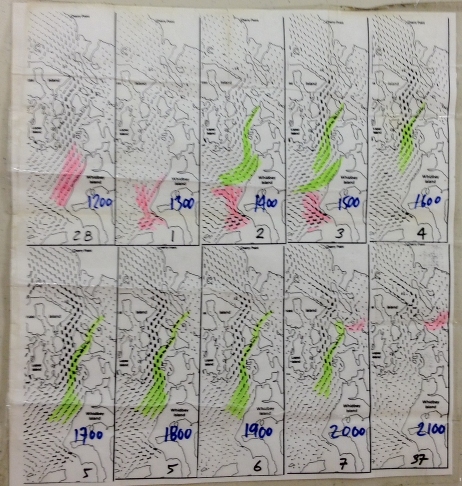
Here we have photocopied charts, just keeping the region we will be sailing in. Then trimmed them and pasted them together for convenience. They are labeled (dark blue) with the local valid time. The small black numbers are to cross reference the actual Current Tables page numbers in case we need to refer back to the book.
Then we have colored in red notable currents flowing north, and in green, currents flowing south... both in the regions we anticipate we might consider in the sail. This overview allows for quick tactical decisions underway.
In this example we did the "laminating" with 2-inch wide strips of clear packing tape. Clear adhesive shelf paper also works for a job like this.
This was prepared for a sailboat race where decisions and change of plans might come up suddenly, but for any cruise this can be useful. It is especially valuable for a kayak or rowing cruise because the vessels are so sensitive to currents, and you do not have much space for laying out books. For small open boat usage, a good lamination or waterproof bag is needed or it will all smear in a short time!
We have put a note about this on our Facebook page, which is an easy to post questions or comments if you like. I am sure we have examples from the Puget Sound Tidal Current Tables and will look for some and add them here. It is exactly the same process for any graphic tables data. The idea is to customize the layout so it shows quickly what you might want to know underway.
Preparation, preparation, preparation. Always the hallmark of good seamanship.
david burch
www.starpath.com